


Sometimes, numbers speak louder than words. A vague “people seemed to enjoy the social wall” won’t hold up in your next budget review. That’s why you need to pay more attention to social media wall analytics — built-in reporting tools that put real numbers behind your results. They show you how many posts were collected, which platforms they came from, and how audiences engaged with them. In short, the data you need to justify your spend and do better next time.
Use these insights to identify what’s working across any use case — and, more importantly, to give stakeholders a concrete reason to keep investing in a social media wall.
🌟 New to social walls? Start with our complete guide to social walls before diving into the analytics.
You can put together a social wall in no time. But when it comes to measuring its success, most treat it as optional. Right up until the boss wants to know what you made of it anyway.
The typical user will set one up, keep an eye on the incoming posts and call it a day. They may get the sense the crowd is interested but they can’t put anything concrete in the post-event report to prove it. There is no hard data to back up the budget request for the following year.
That’s a shame because you are wasting valuable metrics. Your social wall analytics are gathering real data on visitor numbers, where your posters are access the social wall from and how the mood has changed over the course of the day. A quick look at the analytics dashboard will give you all of that in one spot, and it is faster than wading through a string of emails after using it. The data is there; it is just a matter of making use of it.
⭐️ Related: Social Wall Statistics
The Analytics dashboard on Walls.io surfaces several distinct data categories. Here’s what you can learn from each one.
Detailed reporting
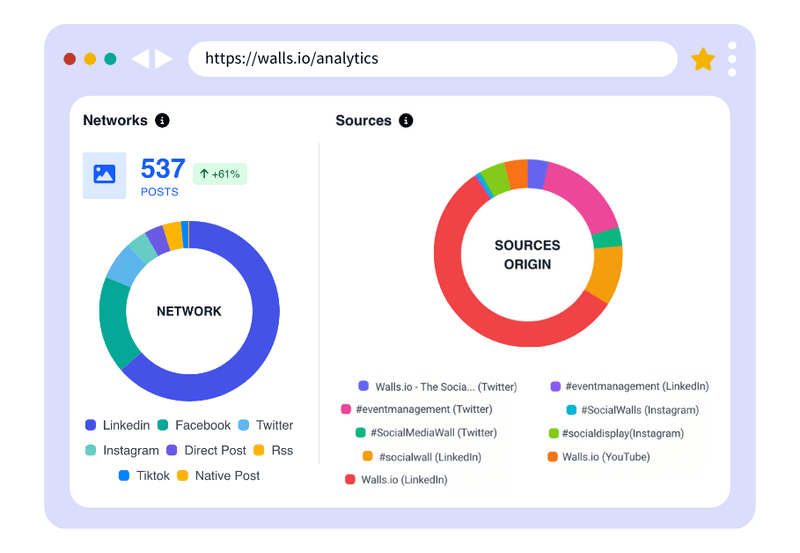
Which social networks drove the most content? Was it Instagram, with X (Twitter) barely showing up and LinkedIn surprisingly active? This data shapes your next campaign’s platform targeting.
While other platforms might group data together, Walls.io distinguishes between overall network data and detailed, source-level insights. As well as a general overview, you can see which specific hashtags, accounts and profiles drove the content. This level of detail is important when deciding where to allocate the promotional budget.
Useful for: finding your most active channels, adjusting platform-specific messaging, deciding which sources to prioritize in your next campaign setup.
👉 Ready to engage your audience?
Start building interactive experiences with Walls.io today
Trends at a glance
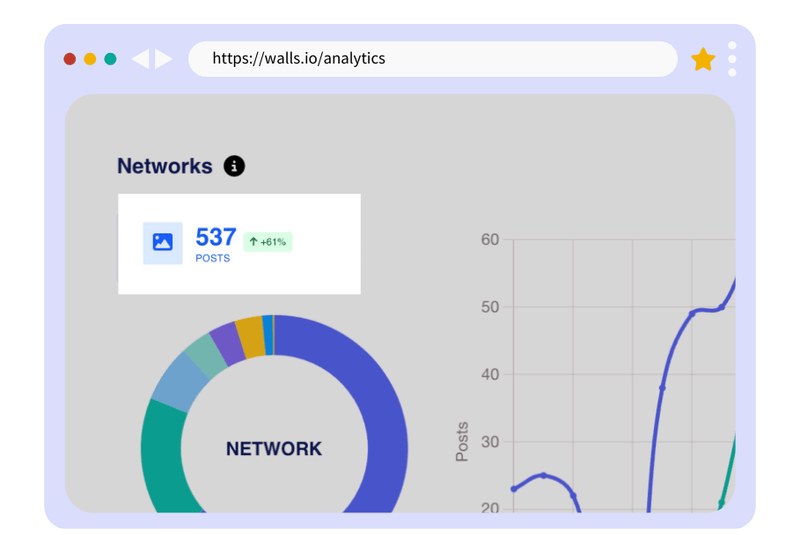
How does your current engagement compare to before? All charts include a percentage indicator that compares your current time frame with the previous matching period. This allows you to identify shifts in performance and adjust your campaigns accordingly.
This is how you transition from one-off reporting to benchmarking, and how you can answer the question ‘Is our engagement growing?’ with more than just a guess.
Useful for: comparing events, showing improvement over time, and setting realistic targets.
⭐️ Related: Best Social Wall Examples
Flexible data visualisation
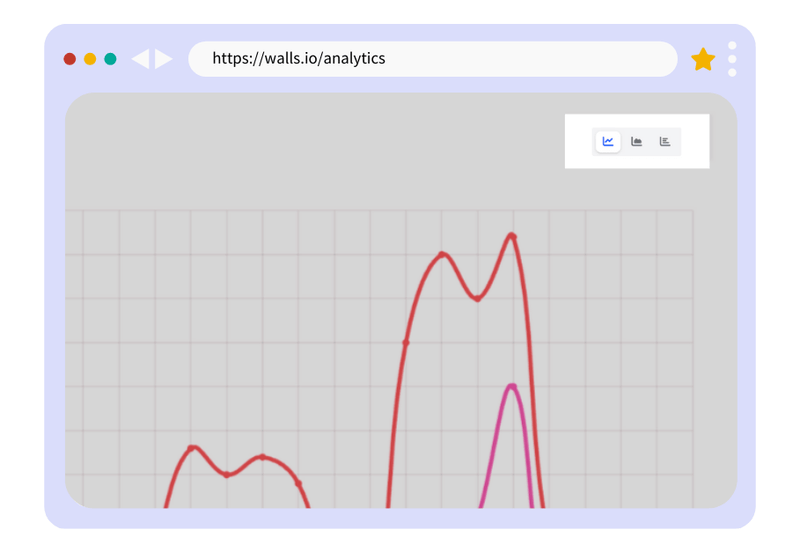
Not all stakeholders want to see the same chart. Switch between chart styles with a single click to explore data and produce reports that fit your presentation needs.
Useful for: tailoring reports to different audiences, from post-event debriefs to leadership presentations.
Audience overview
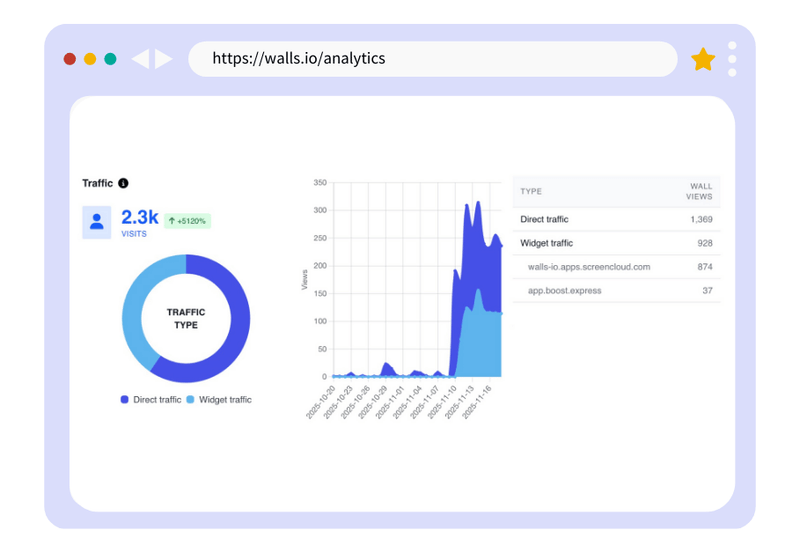
How many people visited your social wall, and where did they come from? This is especially useful for organisations displaying a social wall across different websites or screens, as it allows you to see where you get the most traction.
Many social walls have a surprisingly large silent audience — people who viewed the wall but never posted. Traffic data captures these viewers, and this reach is important for ROI discussions.
Useful for: measuring total reach beyond participant count, understanding which placements drive the most views, and reporting audience size to leadership.
⭐️ Related: Interactive Live Polling
PDF export
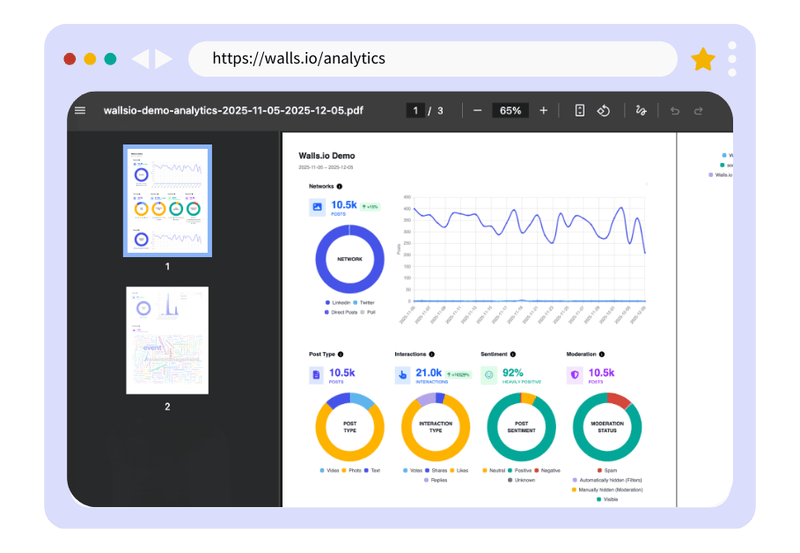
Download all your charts and data into a polished PDF in just one click. Share the report with your team and relevant stakeholders without having to do any manual formatting.
Useful for: post-event reporting, budget justification and keeping stakeholders informed.
Quick filters
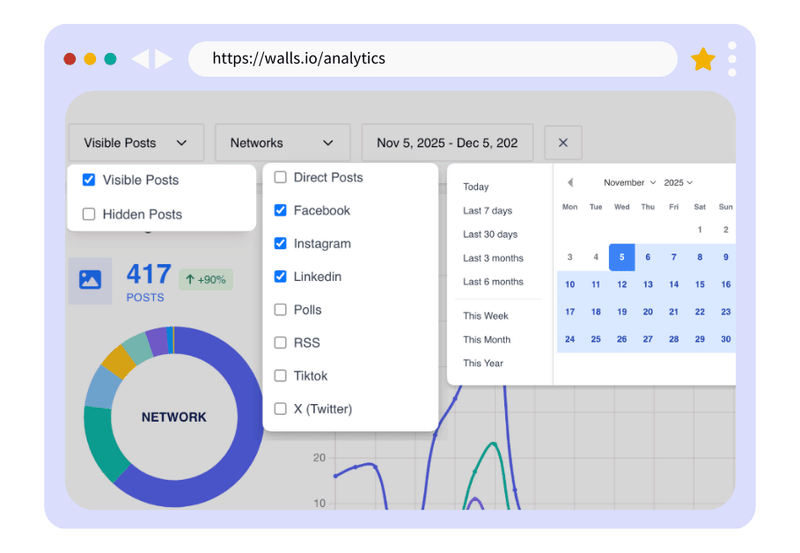
Refine your analytics dashboard by date, network type and post visibility. This helps to keep your analysis focused, whether you’re reviewing a one-day event or a campaign spanning several weeks.
Useful for: isolating specific time windows, comparing individual platforms, and filtering out content that wasn’t publicly displayed.
⭐️ Related: Privacy-First Social Feeds
Sentiment analysis
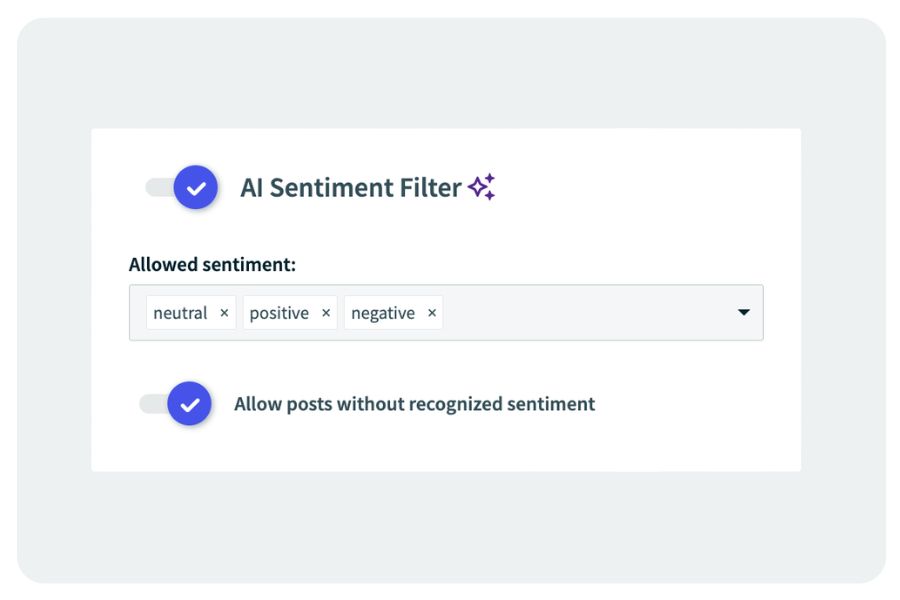
Walls.io’s AI Moderation, which includes an AI Spam Filter and AI Sentiment Filters to help you maintain a professional and on-brand social wall, also feeds into your analytics. The sentiment breakdown shows the proportion of positive, neutral and negative posts.
For brand campaigns, this is a measure of perception. For internal events, it provides an accurate reflection of morale and energy levels. If sentiment dips mid-event, you have something concrete to act on.
Useful for: brand health checks, post-campaign debrief, identifying if a particular session or topic shifted audience mood.
⭐️ Related: Social Wall Design Options for Brands
It’s easier to discuss the return on investment (ROI) when you have numbers. Here’s how to build your case:
Step 1: Define your goals. Does having more posts mean more engagement? Is it more about the traffic that results in more reach? Do positive feelings about a brand mean the brand is healthy? You need a goal to make the data meaningful.
Step 2: Create a PDF export. Walls.io’s one-click PDF export will save all your charts and data so you can share them with others. You don’t have to take screenshots or manually build tables. You can include this in a report or presentation after the event. It will only take about two minutes.
Step 3: Connect the wall to a broader business outcome. For example, Cisco held a Leader Day event. They measured 9,000+ page views on their social wall. They also estimated that 115,000 people saw their #CiscoLeaderDay posts. On the day of the broadcast, there was a 107% increase in mentions of #CiscoBeat on social media. This is not just “people used the hashtag.” It’s a way to make the company’s reach bigger, which can be included in a financial report.
Step 4: Use trend comparison to show progress. For example, if this quarter’s event had 30% more posts and 15% more visitors than last quarter’s, we could use that to justify the budget for next year.
The social media wall metrics that matter for you will always vary depending on your goal, your audience, how experienced you are in engaging people, and how much you promote your branded hashtag or the wall itself. Of course, there is some base that we can use as a benchmark.
The number of posts per person who attended: For an event where people are actively using hashtags, 5–15% of attendees posting something is a good participation rate. If the percentage is less than 2%, it usually means that the social wall was not visible enough or the call to action was buried. So make sure to add your hashtag or QR code E-V-E-R-Y-W-H-E-R-E.
Platforms: The more platforms you use, the more likely you are to gather more posts from your audience. A healthy multi-source wall draws from at least 2–3 active channels. But this will depend on your goal and use case. Corporate events usually stick to LinkedIn only, and that is more than fine!
Post sentiment: For brand campaigns, try to get at least 70% positive sentiment. For internal events, even higher. The key to a successful event is happy attendees, so any gathering should aim as high a sentiment post as possible.
The number of posts divided by the number of traffic visits. If your social wall gets 10 times more views than posts, you have a large silent audience. That’s not a failure, but an opportunity to get viewers to join in by offering better ways to participate. Check out our guide on how to get more people posting to your social wall for specific tips.
BeSet yourself up for success. This checklist will help you have an overview of the most important aspects of social wall metrics. Make sure to revisit it before your next campaign:
- Define your success metrics before anything else. Choose 2–3 important metrics, and write them down before launch. You could discuss it with management too, to be on the same page.
- Determine a date range. Have a very clear launch and end date so your analytics cover the right window. Make sure to include any pre-event promotion efforts.
- Test the filters after using the wall. Filter by network, post visibility, and date to isolate the signals that matter. It will help you have an individual overview of each metric.
- Export the PDF. Do this right after your campaign; it takes only a few seconds.
- Compare to the last time you used a social wall. Any iteration of your event or campaign will keep feeding your best practices. Make sure to compare every aspect!
⭐️ Related: Data-driven event marketing
In order to keep getting a budget for your social wall you have to show results to management. Some people might think a social wall is a nice to have, when in fact it has become a necessity for many teams. And telling management that “people enjoyed it” is not enough to get approved for a budget.
Social media wall analytics can change that. You can show leadership how many people engaged, how many people saw the content, how people felt about it, and how this event compared to the last one. The PDF export makes sharing easy, so just a few clicks you can prepare a convincing deck.
If you want to see how ROI changes over time, check out the Social Wall ROI guide. It shows you how to connect wall performance data with actual business results.
What does a social wall analytics dashboard show? The key metrics: post count over time, content type (image, video, text), network performance, traffic sources, topics, sentiment, and moderation status — plus how all of this compares to a previous period. Walls.io’s dashboard covers all of this, with hover details and flexible chart types so you can look at the data the way that makes sense to you.
How do I export my social wall data for a report? Walls.io has a one-click PDF export that turns all your charts and data into a formatted report — ready to share with your team or drop into a post-event presentation. No manual data entry needed.
Can I filter analytics by platform or date? Yes. You can filter by date range, social network, and post visibility. This makes it easy to zoom in on a specific campaign window or compare how individual platforms performed.
What is sentiment analysis on a social wall? Sentiment analysis uses AI to classify posts as positive, neutral, or negative. For event organizers and marketers, this shows how people actually felt about the event or campaign — useful both for reacting in the moment and for reporting afterward.
How do social media wall analytics help justify budget? How do social wall analytics help justify budget? Instead of saying “people engaged with it,” you can show exactly how many posts were collected, how many visitors came through, which platforms drove the most activity, and how it compares to last time. That’s the kind of data that makes a real case for continued investment.
Don’t waste important data. Start paying attention where it matters. The analytics dashboard of your social wall is a goldmine. The information there can help you improve your campaigns, your engagement tactics and even the perception of your social wall.
👉 Start your next campaign with a clear picture of what success looks like
…and with the data to prove it