

You’ve been wondering how to prove to management that a social wall is worth the budget. You’ve looked at the analytics, you’ve seen the happy users first-hand, but you don’t know how to prove social wall value? Then you’ve landed in the right place.
This post talks about the five metrics that give the answers to these questions: How far did content travel? How actively did people participate? How much did user-generated content reduce your production costs? And what did any of it produce in revenue? Each metric we go over has a calculation so you can put a number on it, and then show it who it matters to. You’ll be able to prove social wall value easily.
🌟 New to social walls? Start with our complete guide to social walls before diving into the ROI.
Let me tell you a story of a Walls.io customer.
Maya had planned many events. She could tell when a room was dead and when it was alive.
This one was alive.
People weren’t just sitting, they were taking pictures with their phones and checking the wall to see if their photo was up. Someone in the third row laughed when they saw themselves on the screen. A speaker paused mid-sentence to point at a post that had just gone up. The room was talking back, and everyone could see it happening right away.
When the event ended, Maya closed her laptop, knowing that something had worked. She just couldn’t say exactly what, or how much.
A few weeks later, she was sitting across from her manager with a budget renewal form between them. She had been here before, trying to explain a feeling to someone whose job involves numbers. “The energy was different,” she said. Her manager nodded slowly, in the way people nod when they’re being polite but not fully convinced.
So Maya looked at the data again.
She looked at the analytics and started doing the math she’d never thought to do before. The wall had collected 1,400 posts. Even if she had only spent $75 on each post, she would still have spent over $100,000 on content if she’d had to pay for it. The campaign went viral, reaching seven times more people than the attendees who posted. People interacted with the hashtag posts three times more than with the brand’s own social content during the same week.
The feeling in the room had a number. She could finally quantify the success of the social wall and present it to the important people.
And you can do like Maya too, if you pay attention to the metrics.
👉 Ready to engage your audience?
Start building interactive experiences with Walls.io today
👉🏼 Related: Social Media Wall Analytics
1. Organic reach amplification
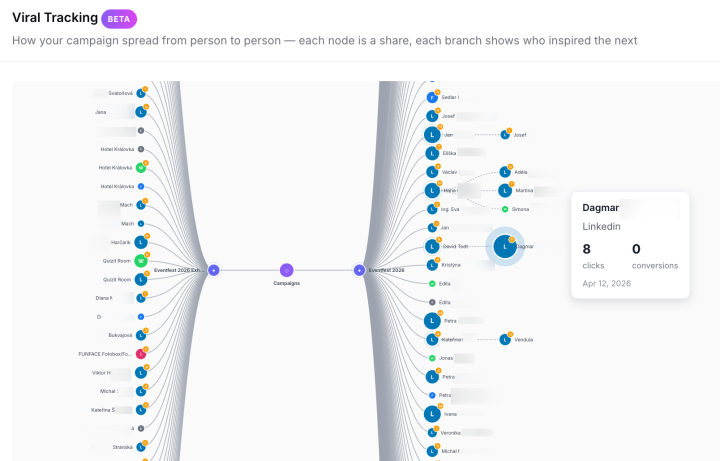
If you’ve been using our pre-event marketing tool, then the best way to measure the impact of social walls is to compare how far attendee content traveled versus your own brand posts.
Echo is Walls.io’s tool for organic pre-event marketing. It turns your audience into your own little brand ambassadors. With Echo, everyone in your campaign gets their own social sharing card with a unique tracking link, so you always know exactly where your campaign traveled and who it reached along the way.
Echo also tracks something called a viral boost: the ratio of shares to clicks. Think of it like dropping a stone in a pond. The people who share are the stone but the viral boost measures how wide the ripples go. In practice, customers report a 10-fold increase in the number of people sharing attendee campaigns. For example, the Festival of Eventing saw a 10.7x viral boost from 695 posts across platforms. Event Fest, the largest event marketing festival in the Czech Republic and Slovakia, ran an Echo campaign in the weeks before their 2026 edition. 251 shares led to 802 clicks and a 3.2x viral boost. This means that the event was three times more visible than the direct shares alone would suggest.
To calculate your viral boost:
Clicks generated by Echo posts ÷ number of shares = viral boost
A viral boost above 3x is worth putting in a report. Above 10x is a headline.
2. Content volume and cost avoidance
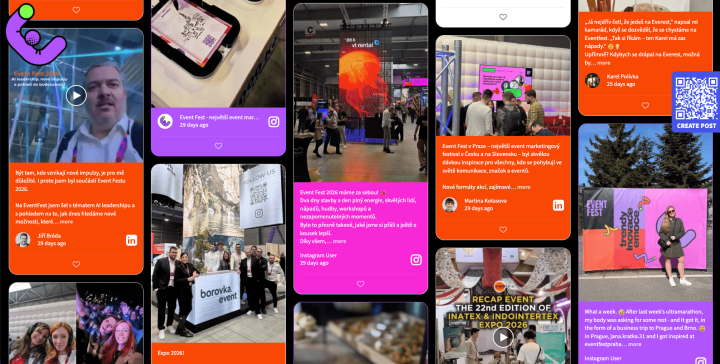
A social wall is like a goldmine of content. Since it’s so easy for people to contribute to, it keeps generating real user-generated content that your organization can use after. So technically you didn’t have to produce social proof, and that’s a real life saver and cost reducer.
To figure out the total cost of this content, count the unique posts collected through your wall and multiply by a known production cost. For a basic photo or social media post with a brand’s name, it costs about $50 to $150 for each piece. Videos usually cost between $500 and $2,000 each.
Then calculate like this: The total number of posts x the average cost of producing each one = the cost savings from user-generated content.
For example, an average conference generates 1,200 posts, which let’s say each would cost $75, it adds up to $90,000 in content value. Even if you cut that estimate in half, it’s still a big win.
The other half of this equation is reusing content. Unlike event photos or videos produced by agencies, UGC collected through a social wall is content you can export, repurpose for future campaigns, and embed on website pages and employer branding sections.
👉🏼 Related: Social Wall Pricing
3. Engagement rate vs. brand-produced content
Visual aesthetics play a crucial role in capturing the attention of your target audience. 62% of experts found the natural and authentic visual style to be the most effective for marketing purposes. This style showcases genuine moments, real people, and authentic experiences, precisely what UGC is about. Because of this, UGC gets much more engagement than produced content.
To measure this for your use case, pull engagement data from your social channels for the event period and compare:
- The number of people who interacted with the event hashtag (attendee content) on posts
- The number of people who interacted with your brand posts during the same period
- The number of people who clicked on the links on your website on pages displaying your social wall embed vs. static image pages
The difference between those numbers is your UGC engagement percentage. If your brand posts averaged 1.2% engagement and attendee hashtag posts averaged 3.8%, that difference shows the value of the real content your social wall helped aggregate.
4. Sponsor and partner impression analytics
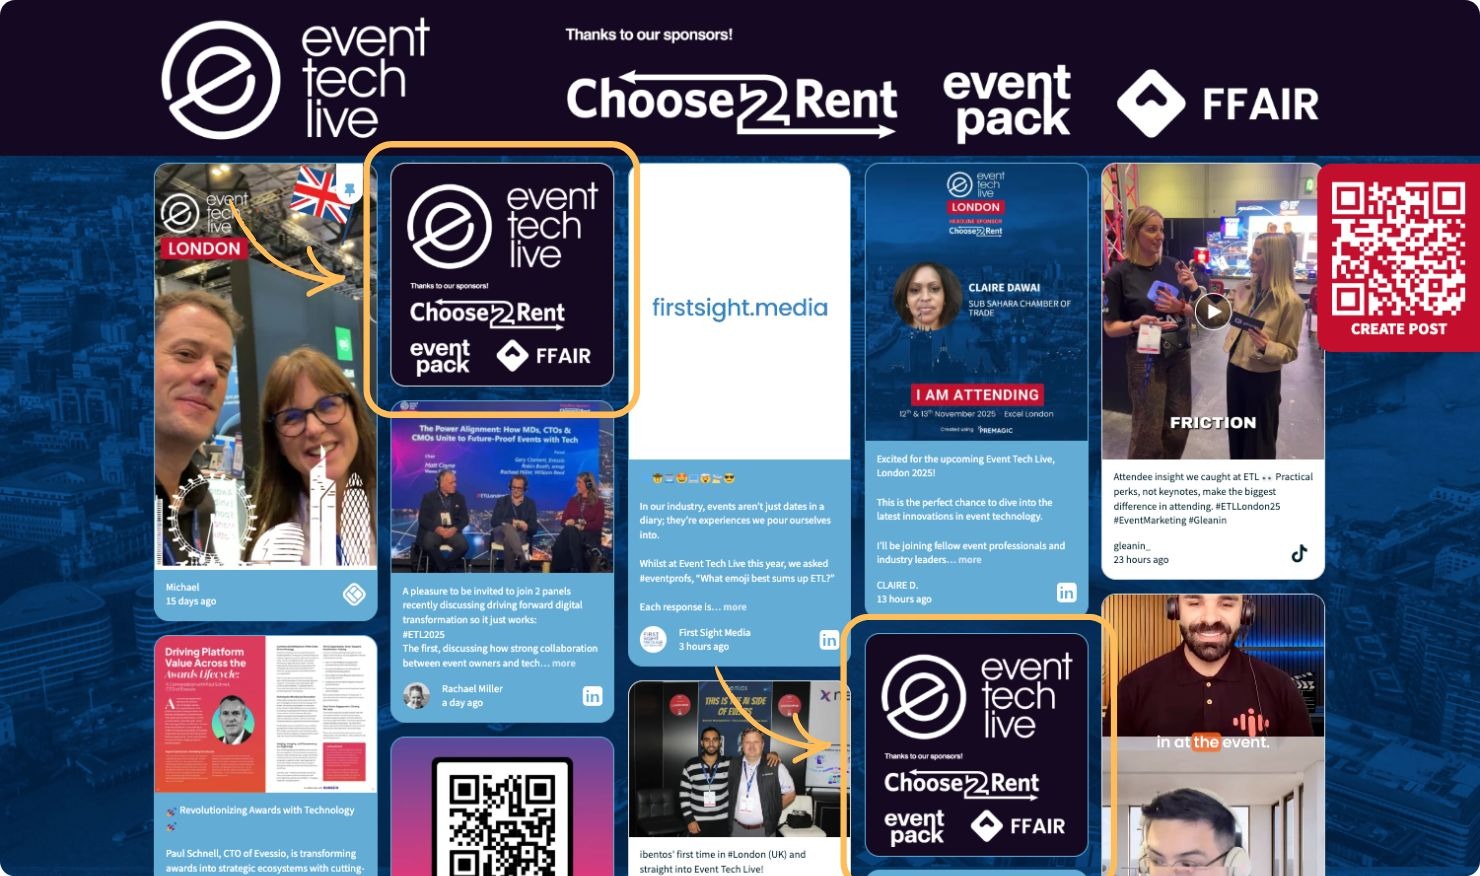
In case you didn’t know, sponsors can make an appearance on your social wall, and it also adds value to your overall usage! If you choose to feature brands, every time someone sees your social wall, it counts as an impression for your sponsors. Walls.io’s analytics show you total visits and traffic of your wall.
To build the argument that sponsors will get their money’s worth:
- First, see the total number of visits your wall received during the event.
- Next, assign a CPM value based on your industry benchmark. This is typically between $10 and $50 for live media.
- Then, calculate the equivalent media spend for the same number of impressions.
👉🏼 Related: Social Wall for Conferences
Total wall visits ÷ 1,000 × CPM benchmark = equivalent media value
For example, if a wall was shown to 3,000 attendees across a two-day event with an average 4-minute view time, at a $25 CPM, the equivalent media value exceeds $12,000. This is before factoring in any digital reach.
This gives you something to include in sponsor recap reports and renewal conversations.
5. Participation rate as an engagement benchmark
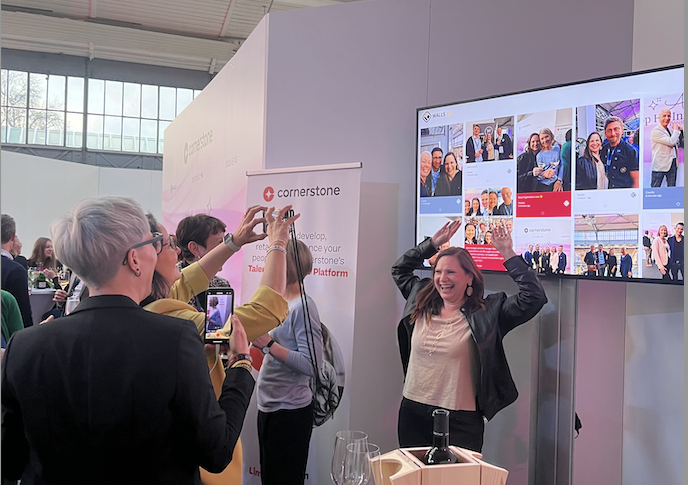
9 out of 10 people expect to actively participate in events, not just sit back and watch, and real-time interaction is something you can include as a success metric. The participation rate is the percentage of your attendees who actively contributed content to your wall. It shows how well your social wall got your audience’s attention.
To find the participation rate:
Unique contributors ÷ total attendees × 100 = participation rate
For events without proper activations, a 5–10% participation rate is typical. With a social wall, a clear hashtag, and Direct Posts enabled, you can get 15–30% of your audience to participate.
Track this number across events and watch it improve as your team gets better at driving it. If more people are using social media, it means your strategy is working.
⭐ Related: How to repurpose event content across your marketing channels
Don’t make the mistake of sending a simple data export to management. You gotta make a story out of the social wall usage so they believe its magic. Here’s a suggestion of how you can create a compelling story for your report:
- The hero, a.k.a. the results: This is one number that shows the total reach, content value, or the Echo multiplier.
- The world building, or context: Here, you should describe what you ran, when you ran it, and how you set it up.
- The story arch, or metrics: Pick the three most important metrics for your use case (reach, cost saving, engagement delta).
- The happy ending: Here, you should mention the content reuse: where the UGC went after the event.
- To be continued: This should be about renewal, expansion, or next campaign approval.
Keep the story to one page, it will make the information much more digestable and convincing. The goal is to get a quick “yes” after the meeting, not to bore the stakeholders.
⭐ Related: Data-driven event marketing: how to use analytics to improve your events
Don’t stay behind. You and your team, as well as your events or campaigns, will benefit from calculating the value that your social wall has brought. You now have all the tools and knowledge to show a convincing case to the decision-makers. Give Walls.io a try and see for yourself the positive outcome.
👉 Engage attendees with a social wall
Your event will become the talk of the town